```{r setup}
#| results: hide
setwd('..')
setwd('..')
knitr::read_chunk(file.path(getwd(),"external_script.R"))
```Let’s make a plot!
this plot will update every time there is new data (and whenever the github action runs)
here’s an intro about my code
1 Code
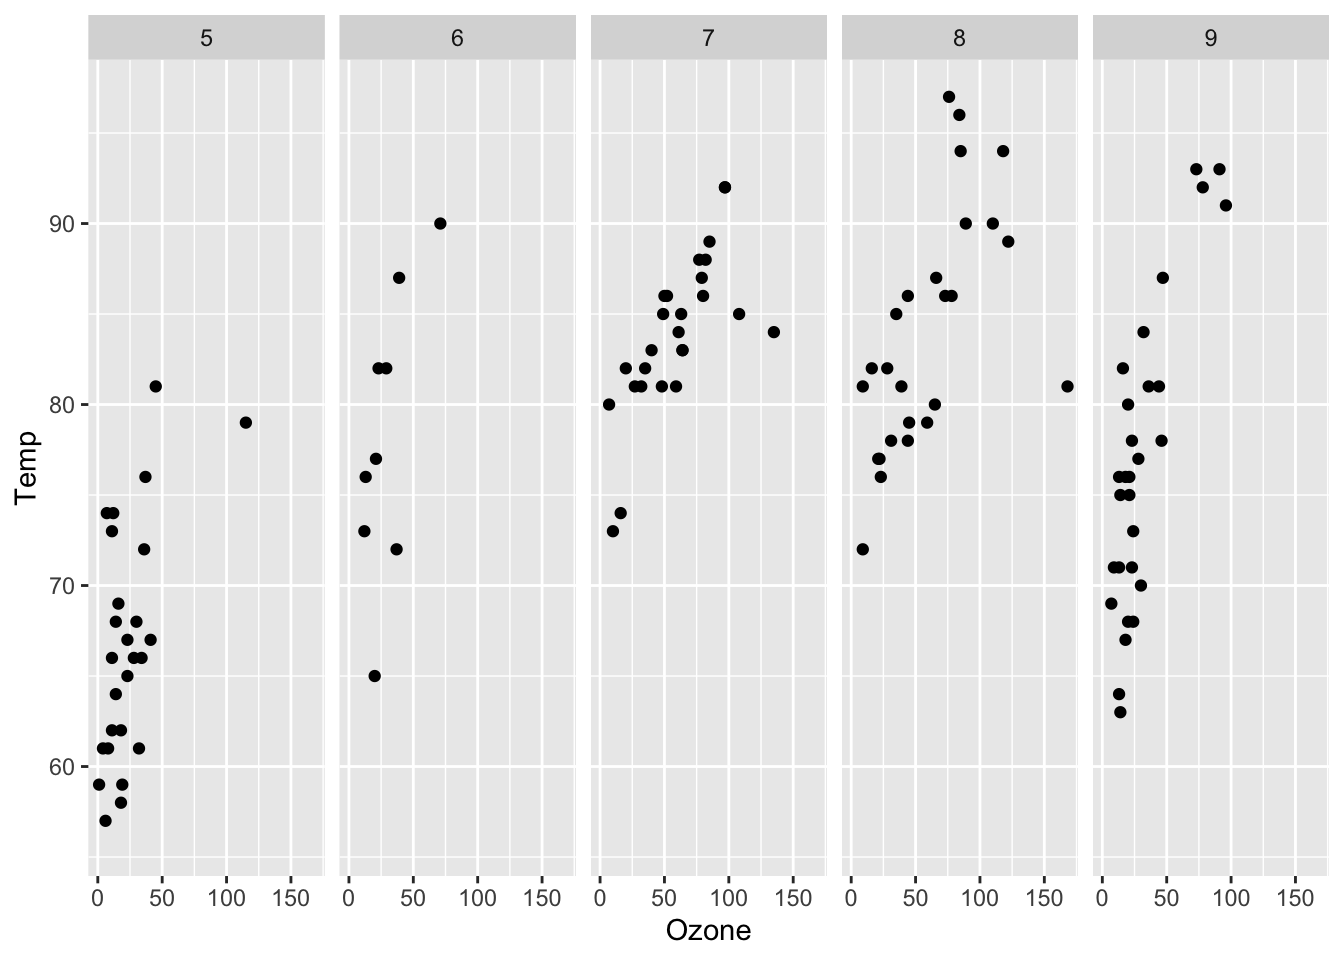
this code will:
- read in the airquality dataset
- produce a ggplot of it
- the ggplot will be stratified by month
```{r make-plot}
(
  plot <- df |>
    ggplot() +
    geom_point(aes(Ozone,Temp)) +
    facet_grid(~Month)
)
```
Warning: Removed 37 rows containing missing values (geom_point).